Monitoring an IoT Fleet
IoT devices are inherently distributed across many locations. One of the worst things that can happen to them is that that they suddenly go offline and an expensive on-site visit is required to repair them. Monitoring can help prevent some device failures:
- Warnings about certificates that are about to expire can be sent to the backend and countermeasures can be initiated.
- A disk cleanup can be initiated to prevent a disk from becoming overfilled.
- An application that would destroy the flash memory through intensive permanent logging can be identified and reconfigured.
Monitoring can also help to avoid the following unpleasant situations:
- Costly bills from mobile network operators can be avoided by monitoring and organizing network traffic.
- Spurious outages of advertised services can be detected and rectified.
The Norway case:
Despite careful testing in many countries, the launch in Norway proved to be a painful failure. The service, which worked perfectly in all other countries, failed in Norway. Due to a lack of monitoring, the error was recognized late and led to customer complaints. Two
"fixed the problem by letting yaml know thatNOwas an ISO country code rather than a boolean value. A monitoring solution would have helped to detect the problem early during rollout.
The above reasons are proof enough that a good monitoring solution is the key to a robust and cost-effective IoT system.
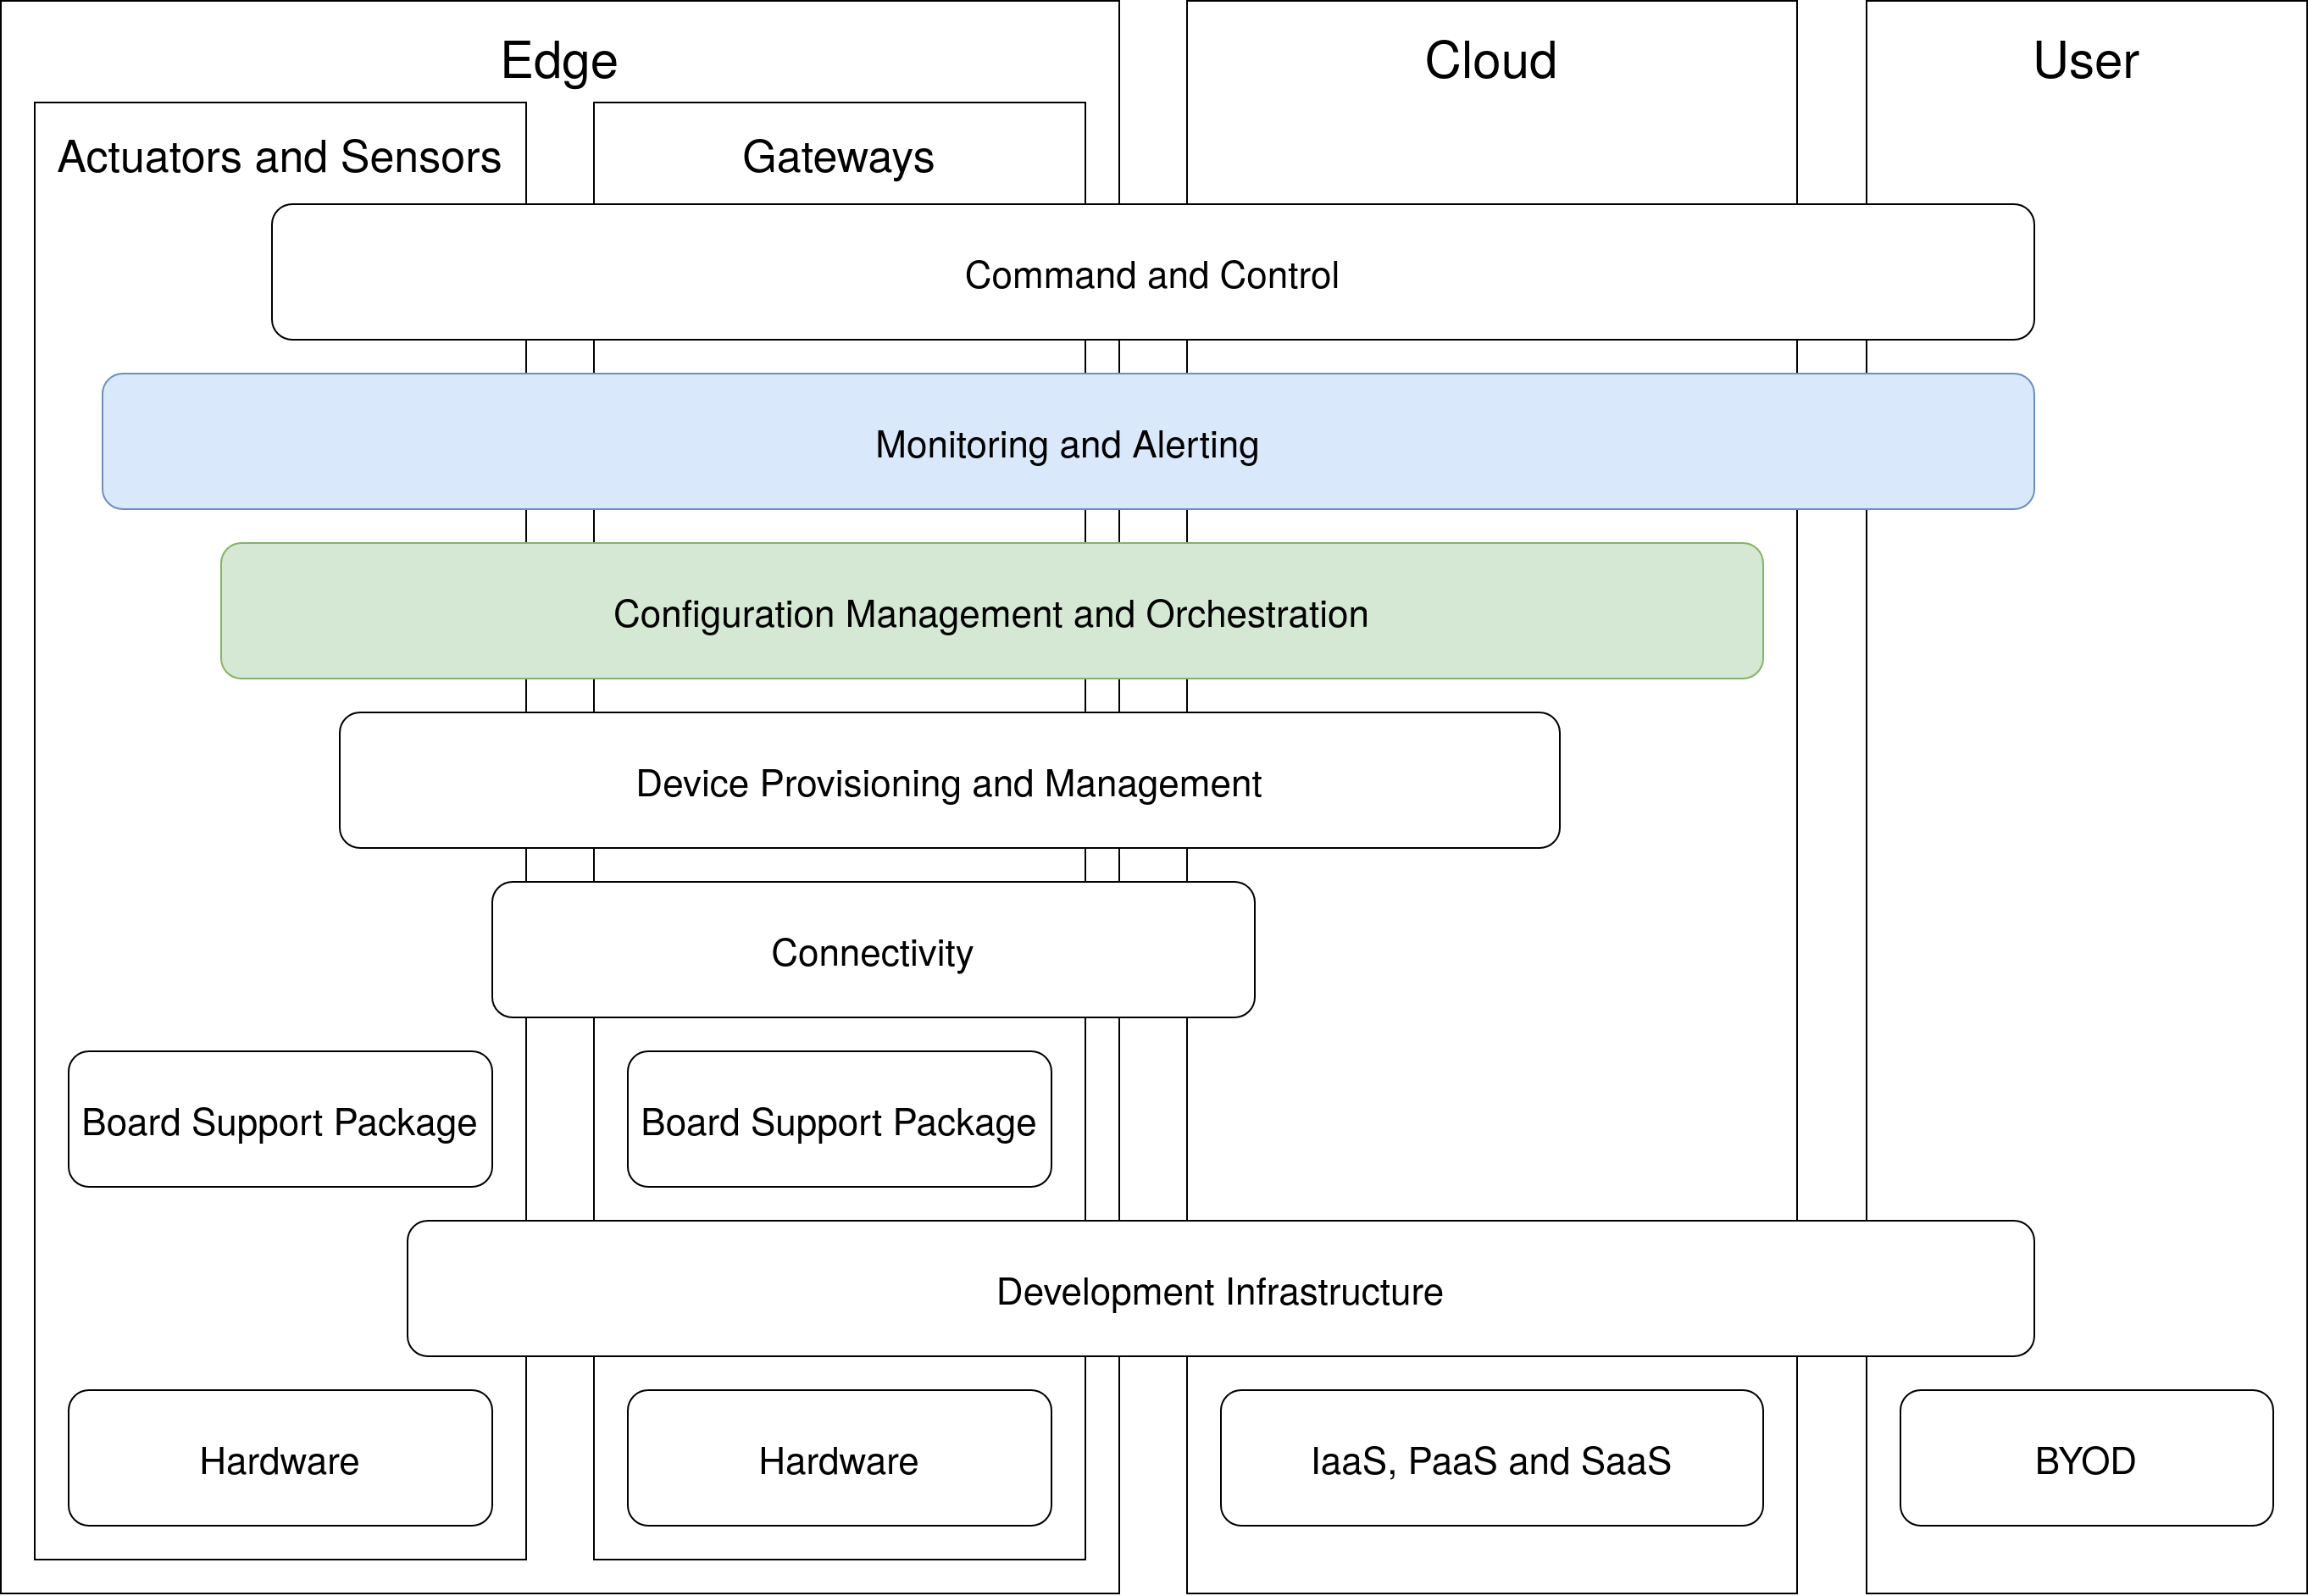
This blog post is about the configuration of a possible monitoring solution for a single device and the subsequent expansion to an entire fleet. The approach follows the principle that an IoT system can be composed of several best-in-class solutions to cover the entire range of use cases. This blog post deals with monitoring and device management layers:
Monitoring a Single Device
When I wanted to select the building blocks for an IoT monitoring solution, I came across Prometheus. This is a very popular tool in the server world, but when I looked at its architecture, it turned out that unfortunately it is not really well suited for the IoT: Prometheus scrapes the metrics from the individual resources that are to be monitored. Such a connection is not normally possible in the IoT world and the IoT devices are supposed to send their metrics to a server.
After further research and discussions with colleagues, I gave InfluxDB and Telegraf a try. My use cases were covered very well, but Telegraf was quite resource intensive. I then decided to combine InfluxDB with fluentbit. Fluentbit is a small agent that runs on my IoT devices and sends data to InfluxDB, which is located in the cloud.
Fluentbit is highly configurable. I use input plugins that capture data, filters that modify data and output plugins that write data to selected targets.
Input Plugins
The cpu input plugin records the CPU load every 60 seconds:
[INPUT]
    name cpu
    tag cpu
    interval_sec 60
A constantly high CPU load is usually a good indication that a service either needs to be optimized for lower resource consumption or that it has even fallen into an abnormal situation.
The mem input plugin records the memory usage every 60 seconds:
[INPUT]
    name mem
    tag memory
    interval_sec 60
The kiosk screen case:
My IoT fleet demo case includes a kiosk screen use case. I usually show my own project page from edi on the screen - a silly, simple and static page. Sometimes during demos, I switch to a newspaper page with animated ads, using the latest and greatest web technologies. A few days into the demos, I noticed that my Raspberry Pi 3 devices were going offline. My first thought was that it was a glitch in the WiFi setup I was using. Monitoring proved my assumptions wrong. When displaying a complex homepage, the Raspberry Pi 3 had run out of memory.
The netif input plugin monitors the network traffic on selected interfaces:
[INPUT]
    name netif
    tag netif.SOME_INTERFACE
    interval_sec 60
    interface SOME_INTERFACE
The key to acceptable connection costs lies in keeping network traffic under control.
All the plugins mentioned above have the typical characteristics of time series. The next plugin, however, records events:
The systemd plugin monitors the journal entries written by the systemd services. Log entries of the severity levels
error, critical, alert and emergency are reported to the cloud:
[INPUT]
    name systemd
    path /run/log/journal
    tag host.*
    systemd_filter PRIORITY=0
    systemd_filter PRIORITY=1
    systemd_filter PRIORITY=2
    systemd_filter PRIORITY=3
The remote access case:
Due to a backend change, a remote access daemon running on IoT devices began to fail. The issue went unnoticed as remote access is only needed to troubleshoot issues on the gateway devices. A few days later, such a problem occurred and a developer was called to troubleshoot. The developer desperately tried to access the device but failed due to the issue affecting the remote access daemon. The above systemd monitoring configuration helps to detect such failures at an early stage.
Filters
The current setup configures two filters:
The modify filter adds the hostname to each record:
[FILTER]
    name modify
    match *
    add hostname ${HOSTNAME}
The hostname can be used to determine the origin of the data set when retrieving data from the InfluxDB database.
The throttle filter ensures that the cloud does not suffer from a DDoS attack if systemd services constantly report
problems:
[FILTER]
    name throttle
    match *
    Rate 20
    Window 5
    Interval 1m
Output Plugins
The influxdb output plugin ensures that all recorded data is sent to the InfluxDB cloud database:
[OUTPUT]
    name influxdb
    match *
    port 443
    tls on
    host INFLUXDB_SERVER
    bucket INFLUXDB_BUCKET
    http_token INFLUXDB_HTTP_TOKEN
    org INFLUXDB_ORG
    sequence_tag off
    tag_keys hostname
Monitoring a Fleet
The above setup takes care of a single device. However, we want to provision the setup to many devices or even the
entire fleet. To automate things, I wrote an Ansible
role that installs fluentbit. The role is run by an Ansible
playbook as soon as the feature flag monitoring_enabled is set to
true. The configuration of each IoT device can be customized individually. Each device is handled as follows
according to its given configuration:
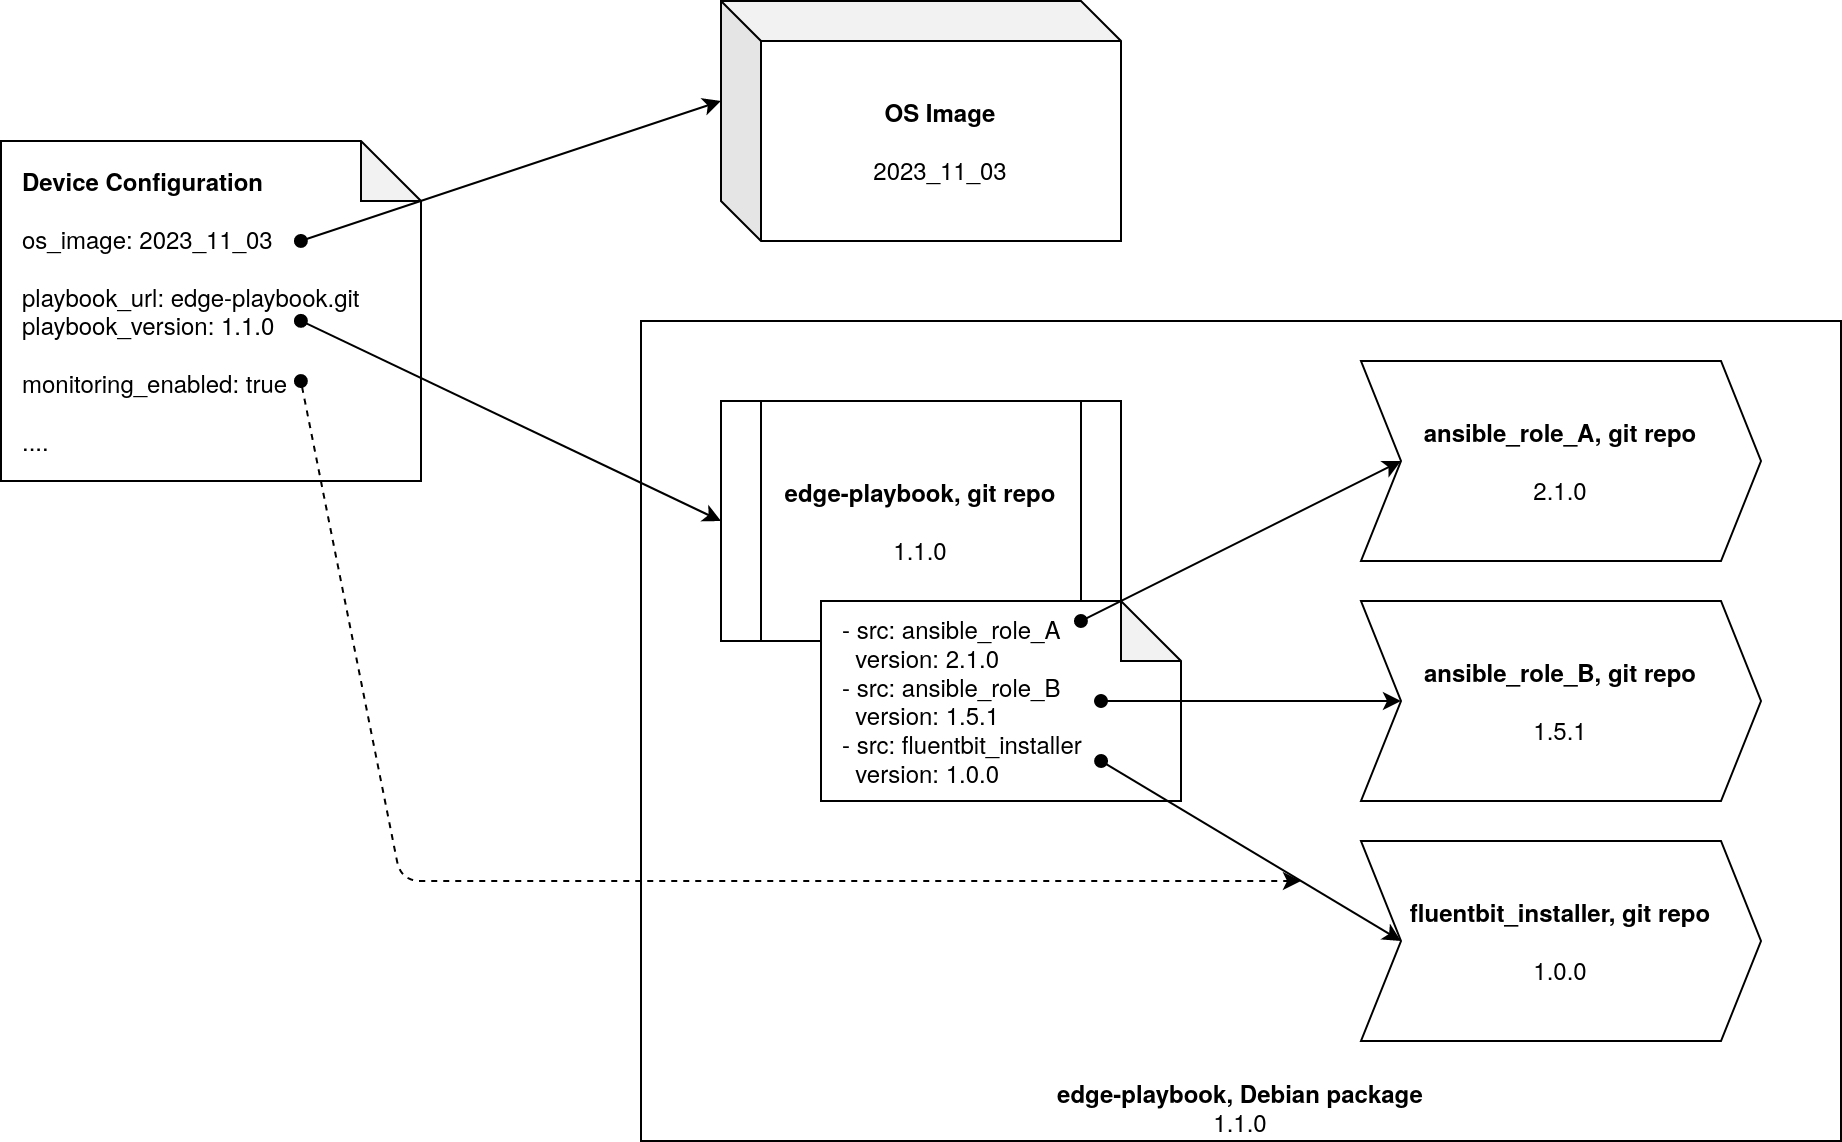
The strict version dependencies make the configuration process reproducible.
The edge playbook and the referenced roles are bundled as a Debian package. While it is still possible to pull in newly developed playbooks and roles directly from a git repository the preferred way for an entire fleet is to fetch those components as a Debian package. With this setup, the production IoT device no longer needs to understand git and the size of the operating system image is reduced by about 20 MB.
The GitOps inspired approach to fleet management ensures that the current device statuses match the desired device statuses.
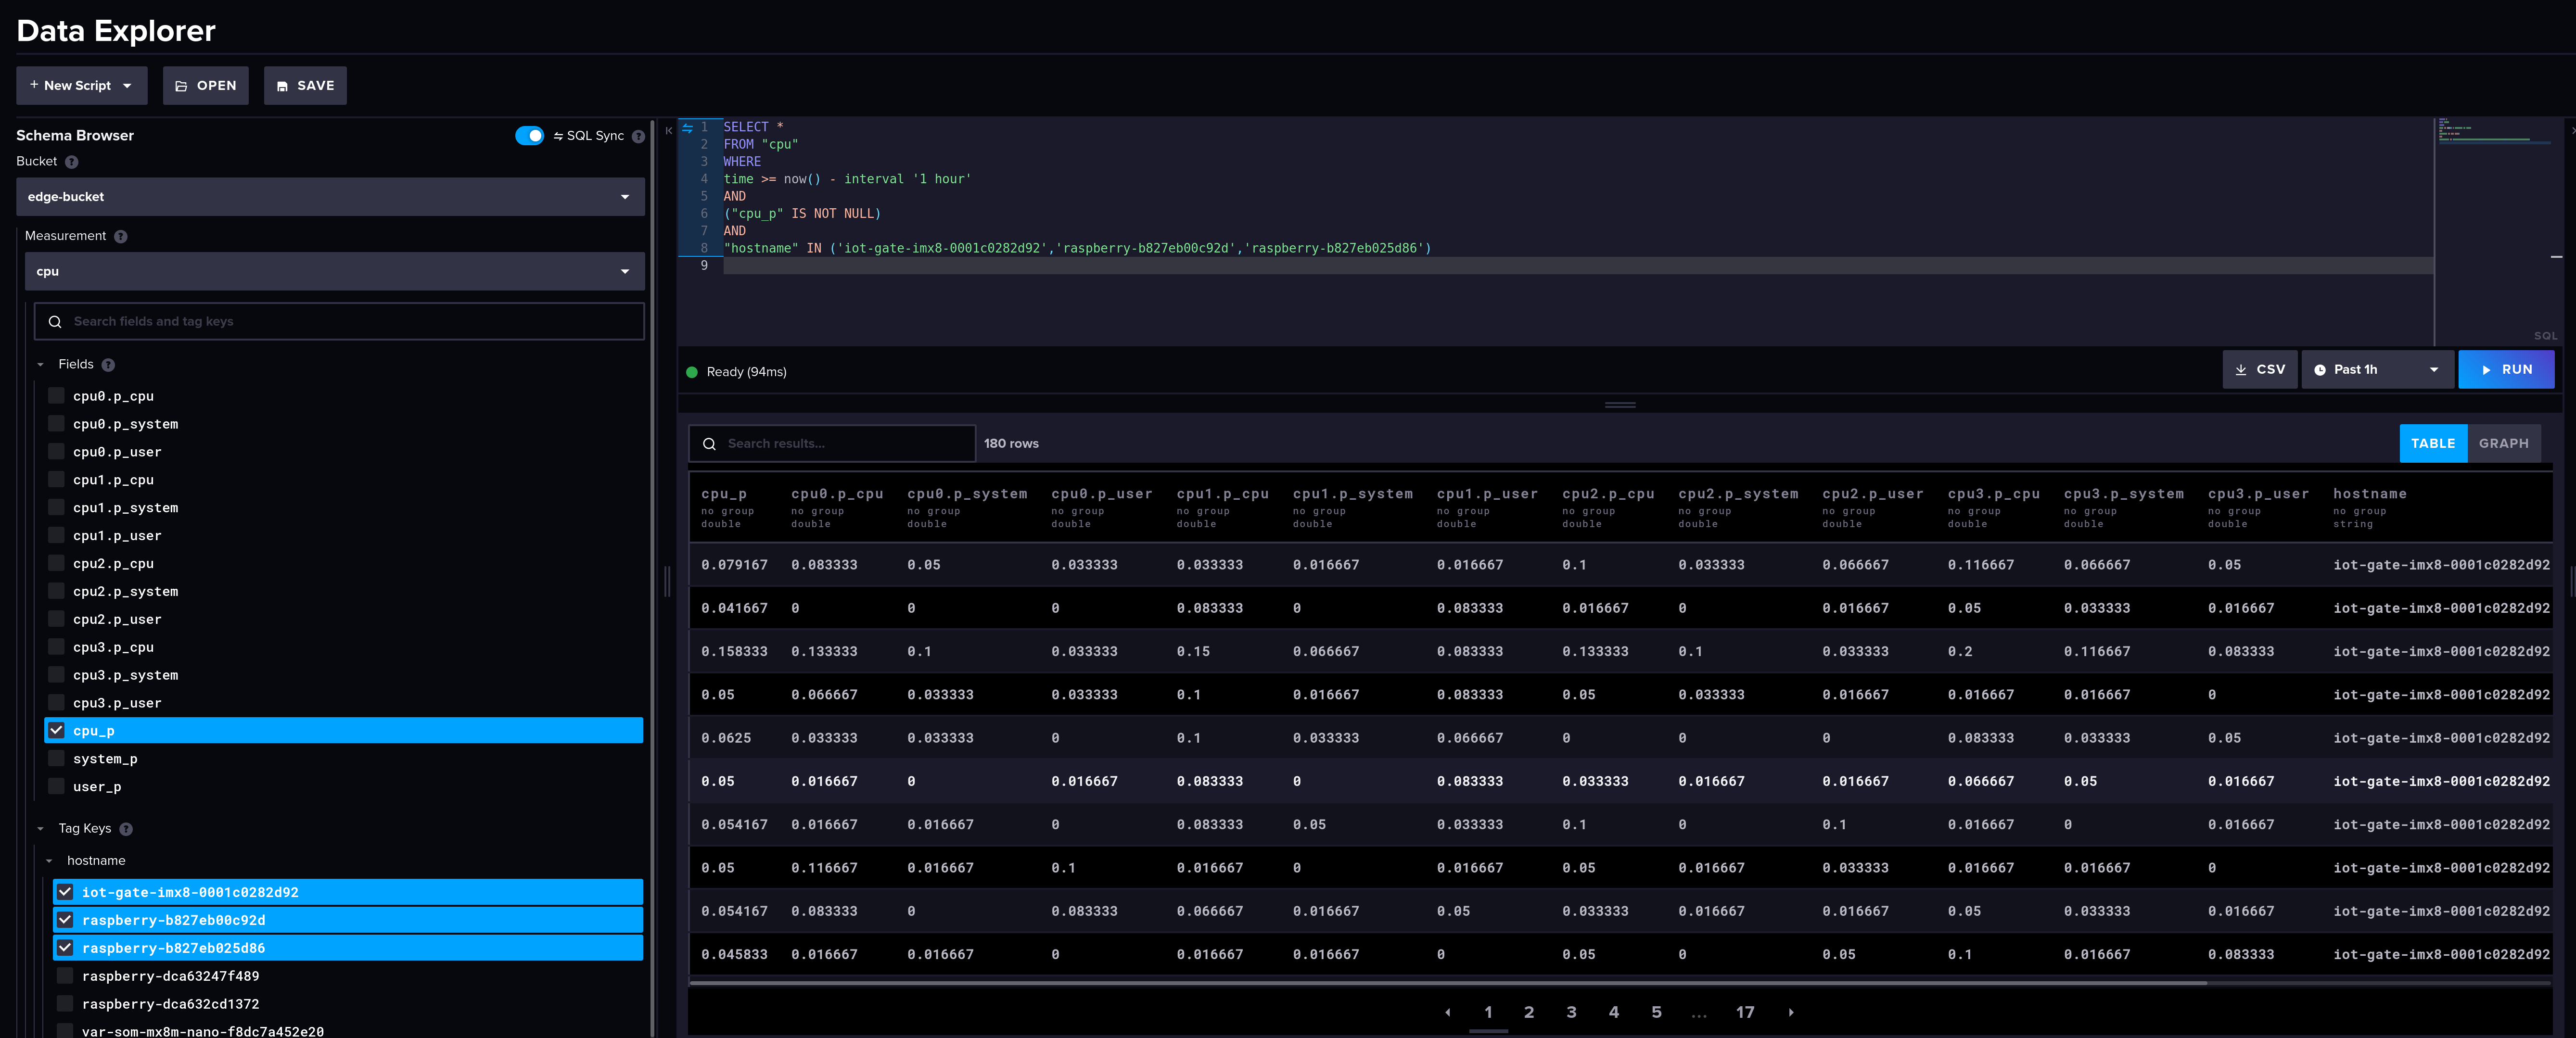
All the monitoring data is now available on InfluxDB and can be retrieved for further processing:
Conclusion
Device monitoring is of great use in keeping an IoT fleet in a healthy state. Fortunately, there are good tools that simplify the collection of data. Developers can then focus on doing something useful with the collected data so that, for example, alerts are triggered when something needs to be repaired. Of course, it’s not just the fleet itself that can be monitored using the approach described above: The above framework also makes it possible to collect additional information and transmit it to the cloud.
Leave a comment